 for multitasking on multicores
eBinder® detail content
1. eBinder Overview
2. Agile-Style Development
3. Advanced/Sophisticated Development Tools
4. Target Development with eBinder
5. eBinder for Arm bundle
6. Using eBinder for multitasking on multicores
7. eBinder JTAG Debugging
8. eBinder System Requirements
9. eT-Kernel™: Part Package for Software Re-use
eBinder features for multitask processes
Program loading
eMCOS POSIX have a loader for dynamically loading programs in the operating system itself. This loader function can be used to load processes on task levels and system programs. Other kernel applications can be loaded with the partial loading functions provided by eBinder.
Debugging
With eBinder's Task Level Debugger, not only can individual tasks in a process be debugged at the task level, but process level debugging can also be performed by stopping all tasks in the process. It is also possible to debug all programs handled by eSOL’s RTOS, including system programs, shared libraries, DLLs, without worrying about information such as addresses where everything is stored.
System analysis
All eBinder system analysis tools can also be used for multitask applications: EvenTrek, PartScope, and Realtime profiler.
EvenTrek can be used to acquire trace information for a task group inside a process and trace information for a task inside a system program or other kernel application, in addition to other information.
PartScope can be used to reference information such as processes and loaded modules, task information inside a process, and information for the different types of operating system resources used by a process.
The real-time profiler can be used to analyze program bottlenecks in your system. The profile results for each task can be obtained to easily understand which functions are frequently executed by which tasks.
eT-Kernel: platform development support
eBinder's platform packaging function can be effectively utilized with the eT-Kernel platform. This eSOL standard supports the distributed development of large projects with many people based on multi-process software applications. It will be supported by the PackageBuilder and PackageInstaller tools. Platform packages can be easily created by using the platform creation template information included as standard in eSOL RTOSes.
eSOL development tool usage examples at multitask process developments
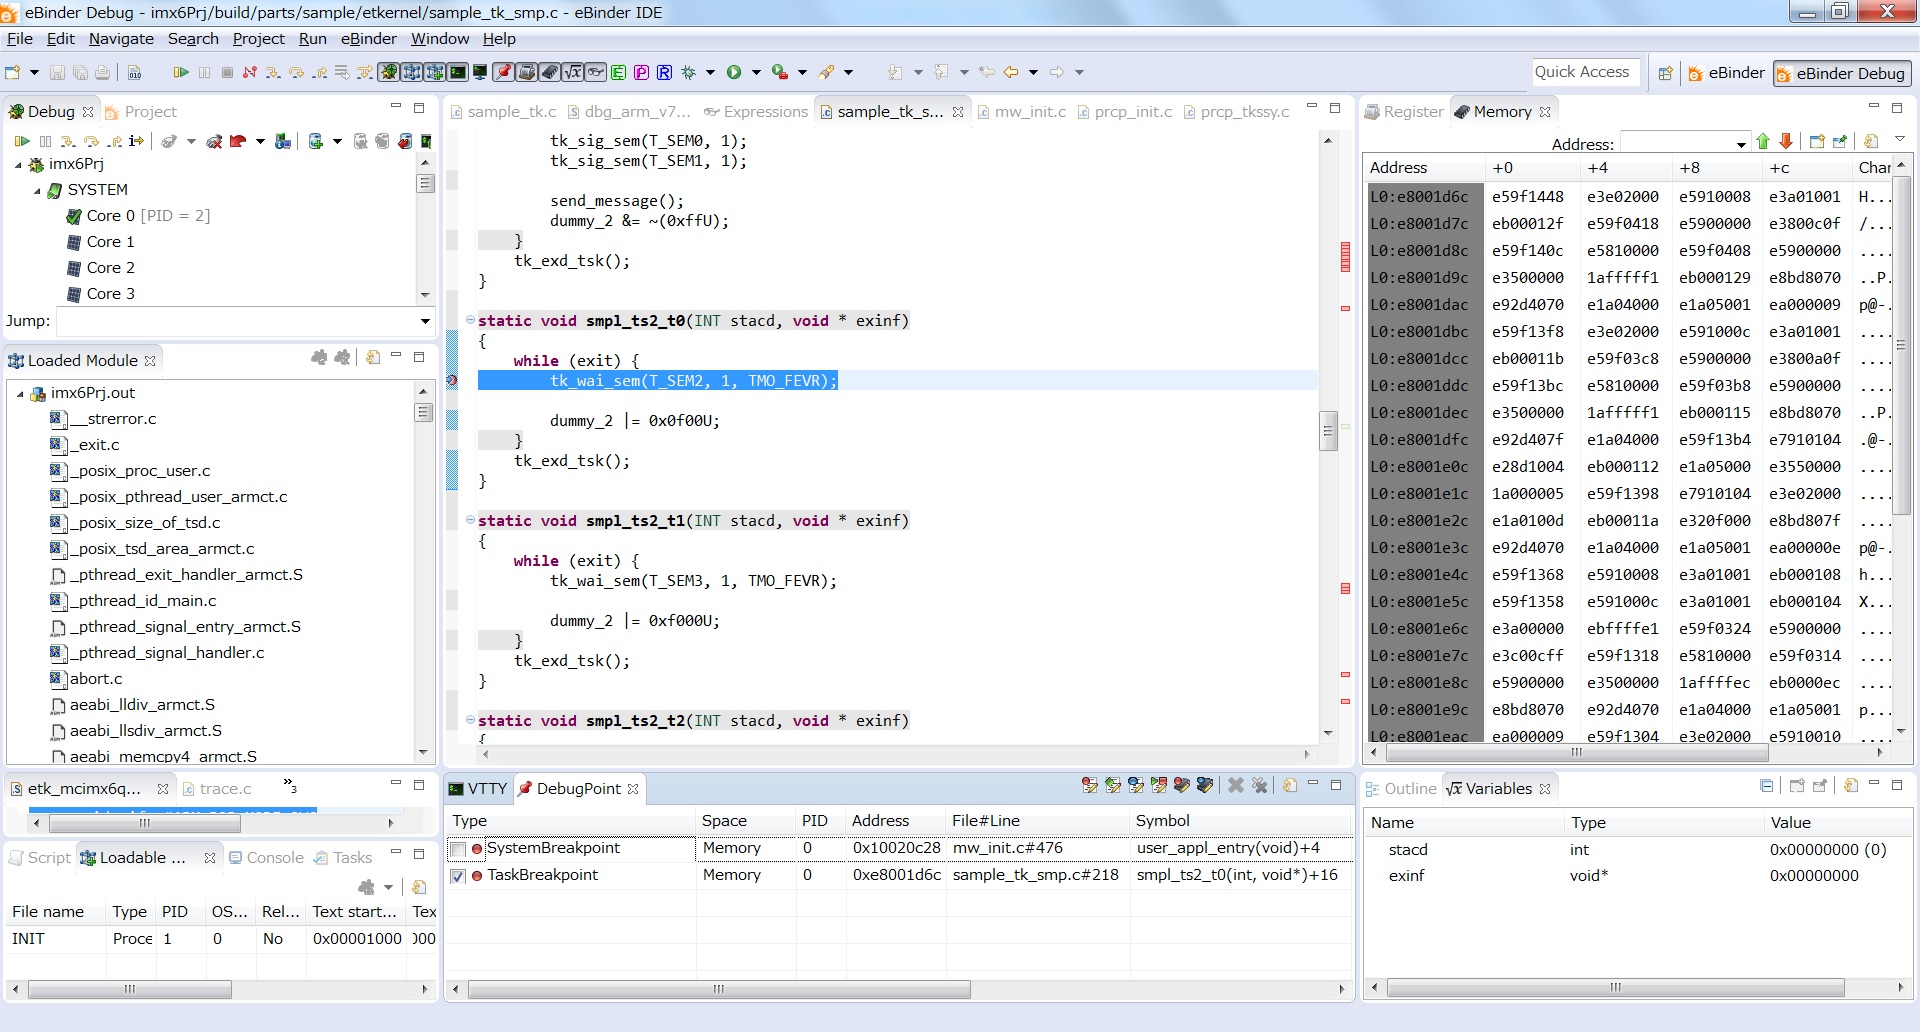
Task Level debugging
Synchronization between tasks and accurate separation is especially important in the case of a multicore processor. It is possible to resolve design issues by using the Task Level Debugger, which can debug at the task level. It is possible to open a window for each task, break individual tasks without stopping the entire system, or step-execute a task to verify multiple tasks in parallel.
Debugging is possible without being aware of the CPU core on which the target task is running. Since eBinder automatically tracks task migrations to another CPU core, it is possible to concentrate on debugging the task.
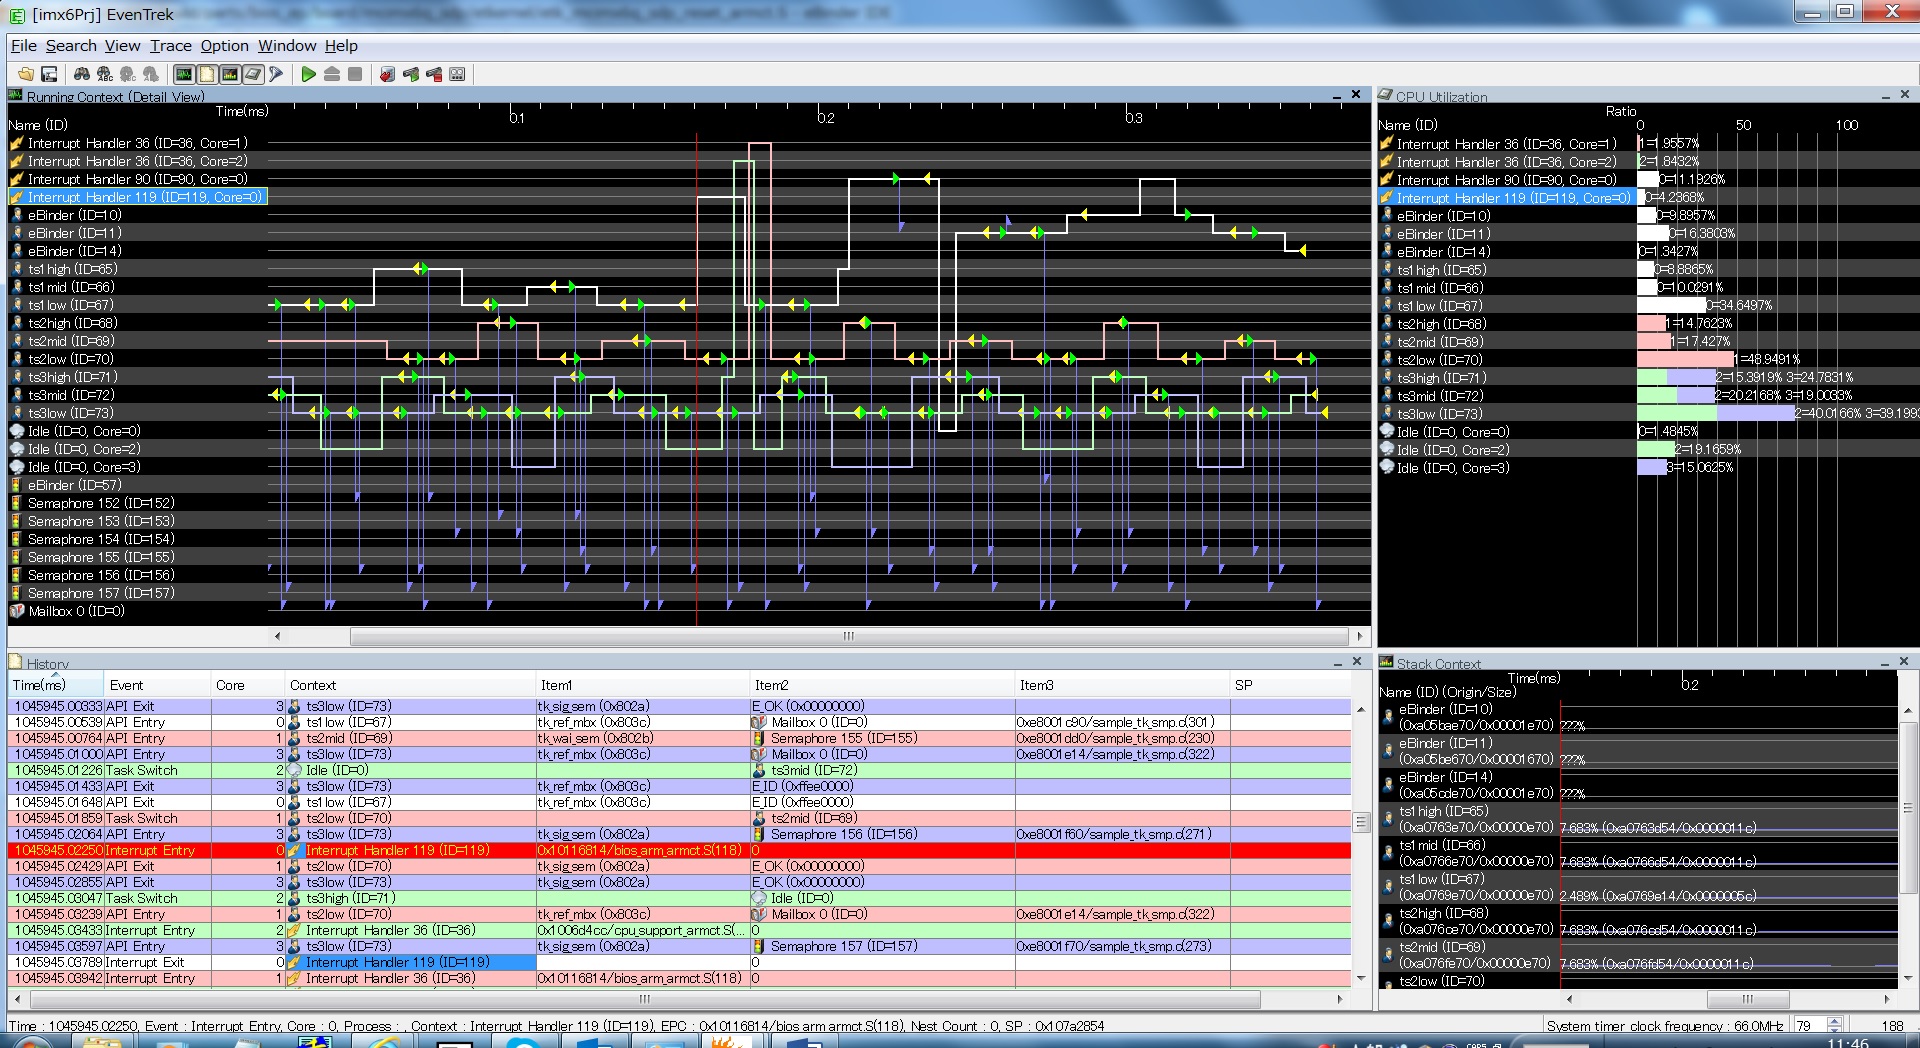
Analysis among programs on different CPU cores and the entire system
Check the behavior of programs running on different CPU cores graphically with the system analysis tool, EvenTrek. Cross-program collaboration or operation of the entire system is shown from a bird's eye view. The following image is an EvenTrek screen showing the analysis result of a program operating on a multicore processor with four CPU cores with tasks and objects color-coded depending on the cores.
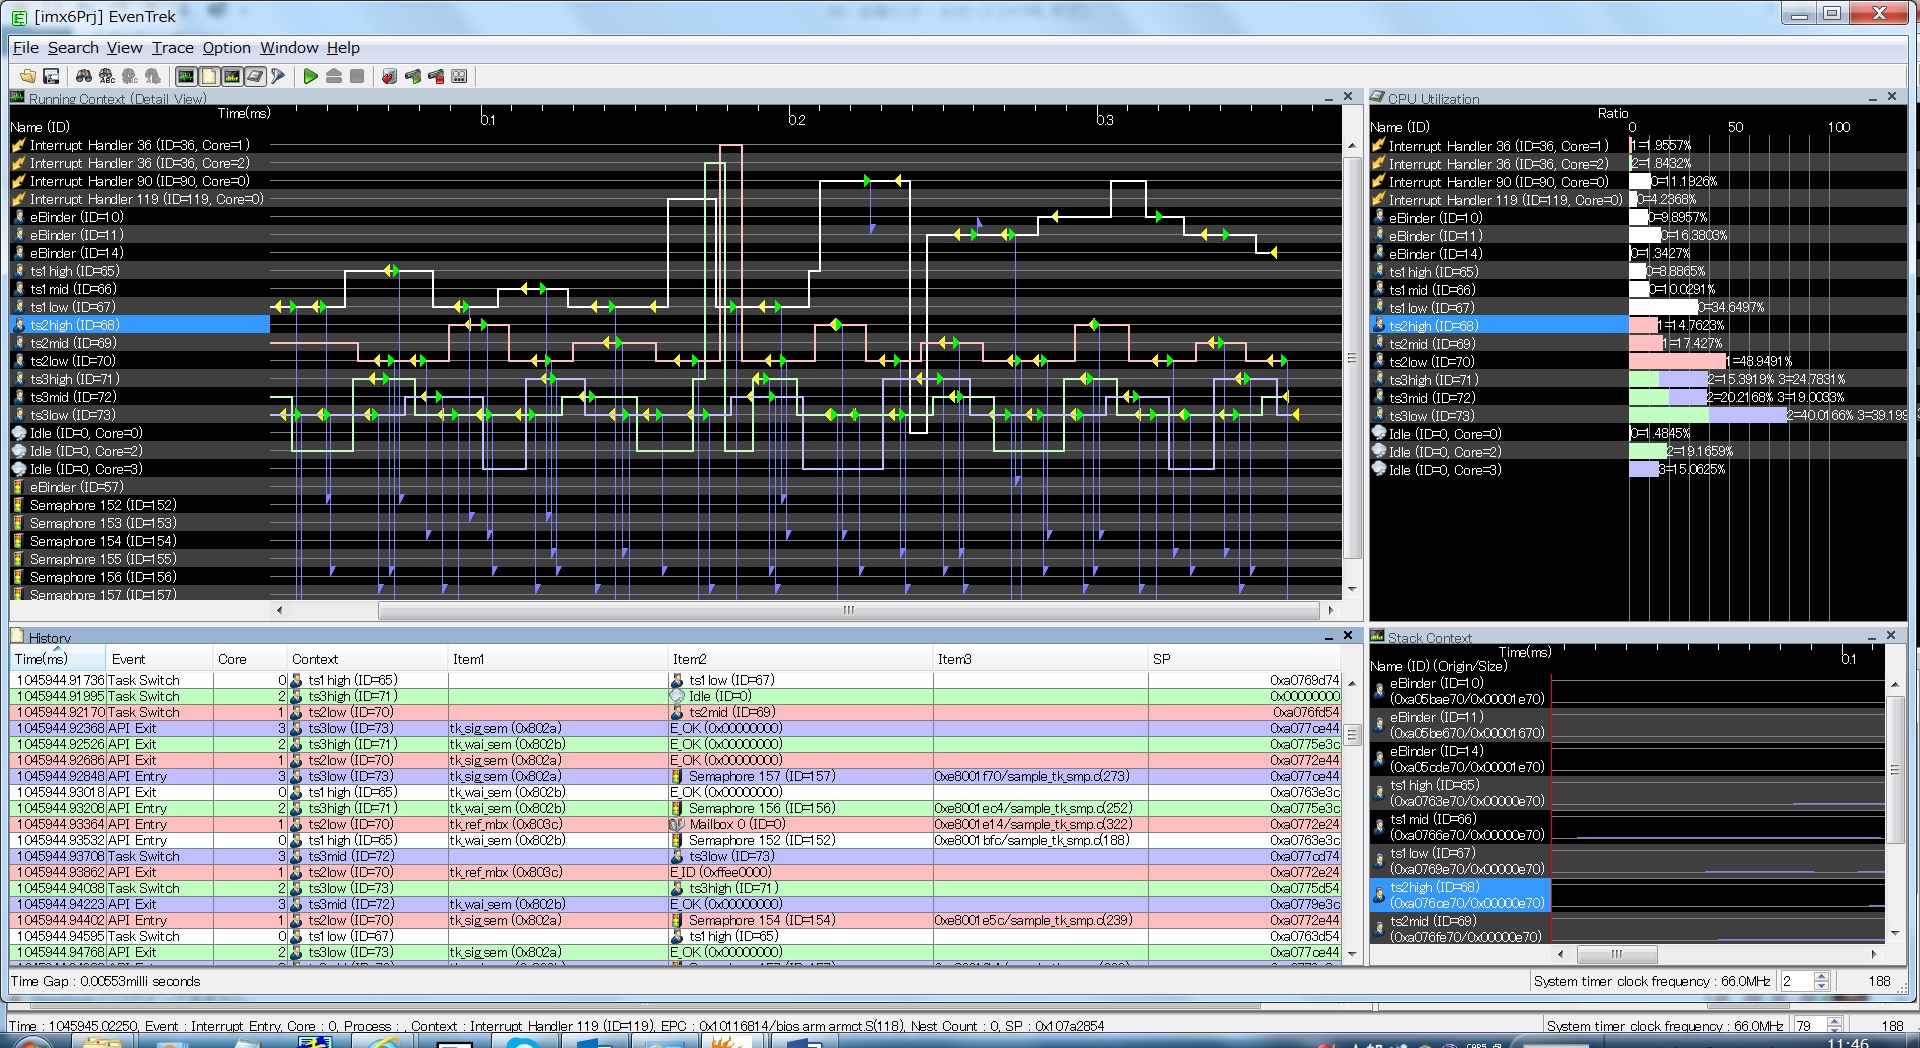
The following image is a chart focusing on the behaviors of tasks and objects running on two particular CPU cores. EvenTrek can filter specified CPU cores for clarified display and easily identify behavior by narrowing down on an analysis target.
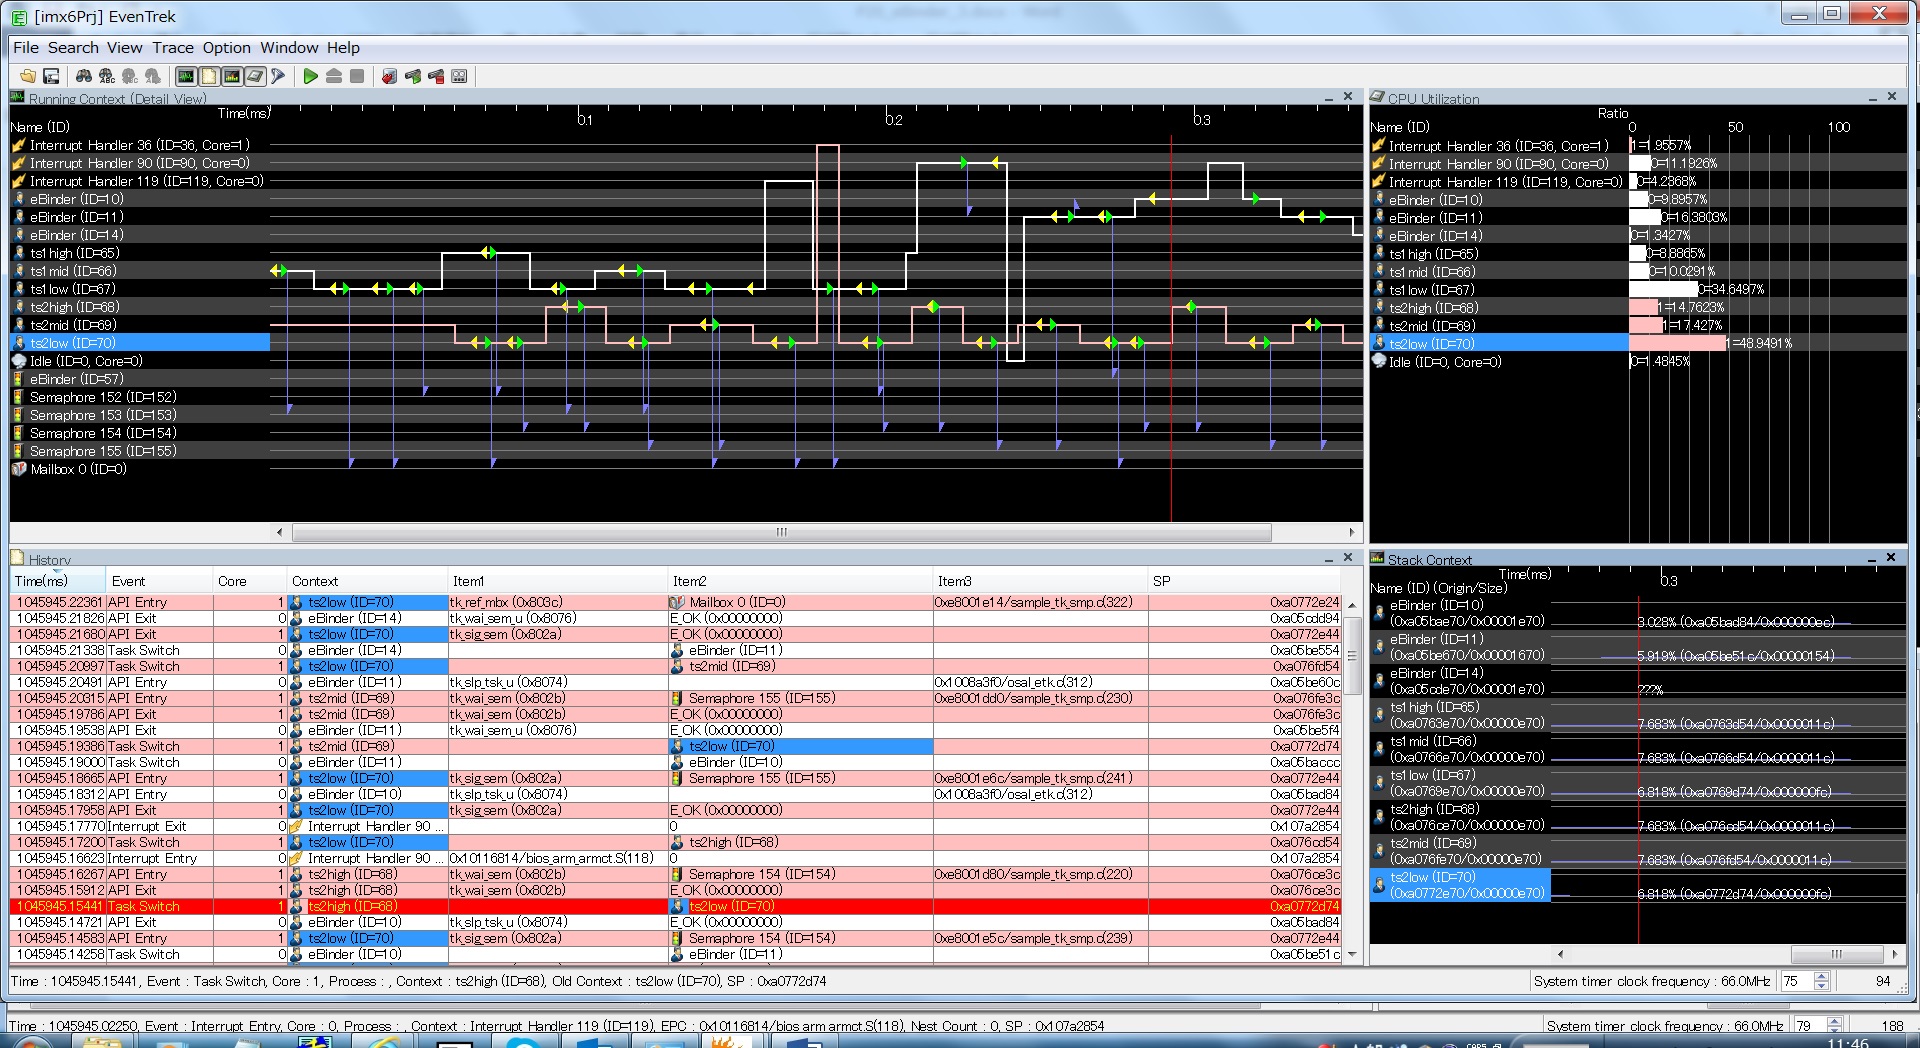
The following is a chart focusing on behaviors of tasks and objects running on one particular CPU core. Debug in this display mode when analyzing a program that runs on a dedicated core. For example, this display can be used when hard real-time tasks for safe application parts are bound to a dedicated core.
Back to top
