eBinder® detail content
1. eBinder Overview
2. Agile-Style Development
3. Advanced/Sophisticated Development Tools
4. Target Development with eBinder
5. eBinder for Arm bundle
6. Using eBinder for multitasking on multicores
7. eBinder JTAG Debugging
8. eBinder System Requirements
9. eT-Kernel™: Part Package for Software Re-use
Agile development style
eBinder supports an iterative and incremental development process, which is common in today’s agile development projects. But to support other systems, especially those with mixed criticality, eBinder offers software module verification.
eBinder can perform unit verification for each task via its partial loading and task generation functions. After unit verification of one task is complete, eBinder can be incorporated into the system to perform system verification. Repeat this cycle to proceed with development.
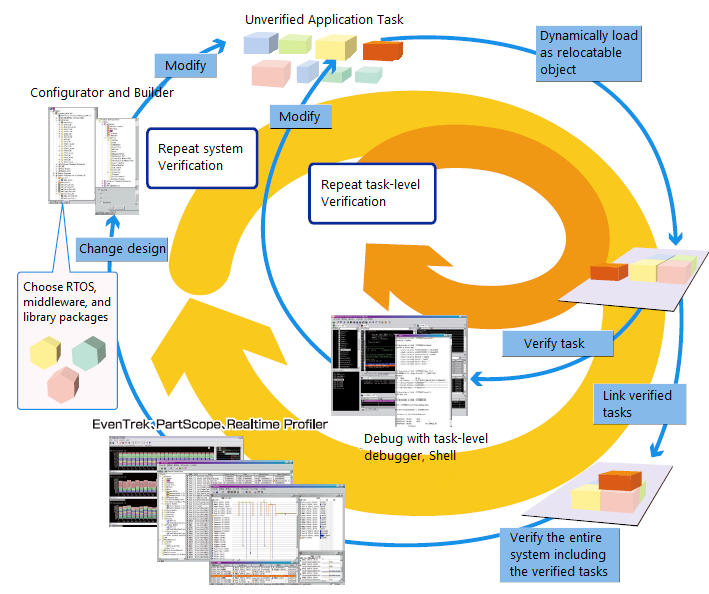
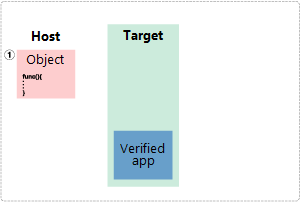
Example for a module-based integration
Development procedures using the iterative and incremental development model
1. Module groups such as kernels, middleware, and verified user code that does not need to be debugged operate in a run-time environment. Programs that need debugging are developed in task/module units.
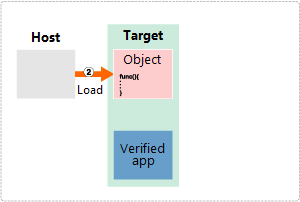
2. Partially load the compiled object program into an operational run-time environment.
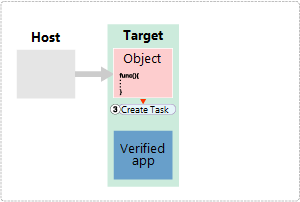
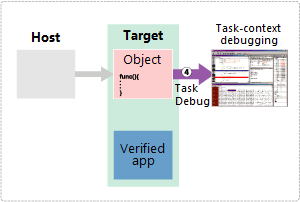
3. Dynamically generate the partially loaded object as a new task.
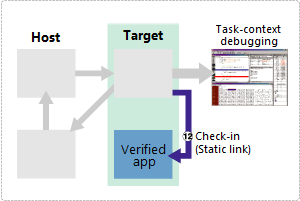
4. Attach the dynamically generated task to the Task Level Debugger and debug it.
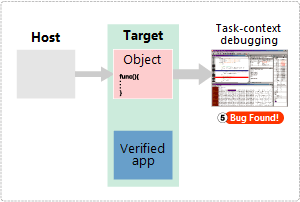
5. If bugs are discovered using the Task Level Debugger, then:
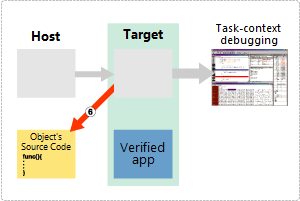
6. Use an editor and other tools to fix the bugs.
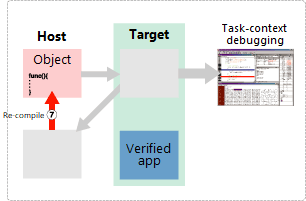
7. Recompile the corrected code.
8. Reload the object with corrected bugs into the operational run-time environment.
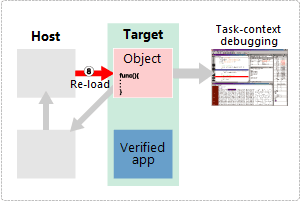
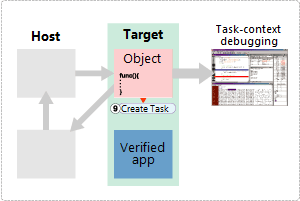
9. Dynamically generate the reloaded object as a new task.
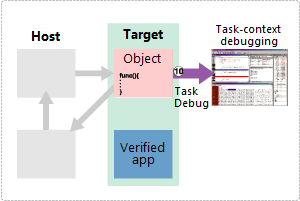
10. Attach the generated task to the Task Level Debugger, and debug it.
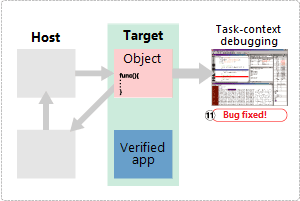
11. Use the Task Level Debugger to verify the bug fixes.
12. Once debugging is complete, add the object to the system (static link).
13. After the task verification is finished, use system analysis tools (EvenTrek, PartScope, and Realtime profiler) and so on to verify the entire system. Repeat this cycle to proceed with system development.
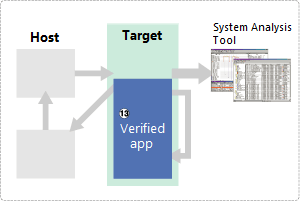
Back to top