 Overview
 eBinder® detail content
1. eBinder Overview
2. Agile-Style Development
3. Advanced/Sophisticated Development Tools
4. Target Development with eBinder
5. eBinder for Arm bundle
6. Using eBinder for multitasking on multicores
7. eBinder JTAG Debugging
8. eBinder System Requirements
9. eT-Kernel™: Part Package for Software Re-use
Agile development support
eBinder is based on an iterative and incremental development model that includes agile development.
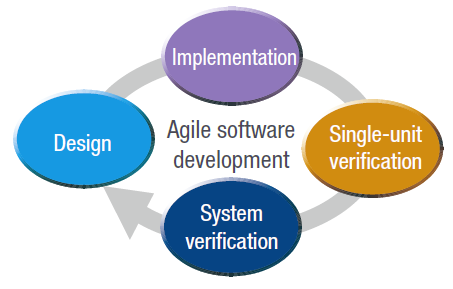
Since the cycle involves repeating task unit verification from an early stage of development and repeating system verification after unit verification is complete, problems can be discovered early in the development process. Furthermore, this model can be used to ensure quality.
Learn moreDevelopment suite for safe real-time application
This suite contains all the necessary tools to manage your source code, debug, analyze and optimize your application.
Learn moreMulticore support
Our focus is multicore and manycore processor support. eBinder supports development using a process model real-time operating system with memory protection functions, such as eMCOS POSIX.
Learn moreUsing eBinder for multitasking on multicores
eBinder supports development using a user process model Real-Time Operating System with memory protection functions.
It is possible to develop using iterative and incremental development in thread tasks as with a single-core processor and debug programs designed on different software paradigms for multicore hardware (e.g., multikernel, SMP, AMP).
JTAG debugging
eBinder already covers support for system debugging by the JTAG interface. We also support established JTAG debugger interfaces of our global partners to enable multi-task debugging at the system level.
Learn moreeBinder for Arm bundle
eSOL provides complete RTOS SDKs covering a pre-integrated genuine Arm compiler. This enables a rapid start to development without cumbersome integration of the compiler into the IDE.
Learn moreSpecial features for eT-Kernel usage
Tailored for efficient development when using eT-Kernel, we have implemented special features that massively accelerate the development of eT-Kernel.
eT-Kernel: Fast target-hardware development
eBinder allows dynamic loading and task generation. New tasks and processes can be loaded at runtime during system execution. This eliminates the need to relink and reload the entire system whenever code is revised and can significantly reduce wait time for quick testing, enabling improved develop-and-debug cycles. In addition to loading, creating, and debugging tasks, processes can also be created, started, and debugged on a real target.
Learn moreeT-Kernel: Software asset reusage
eBinder includes mechanisms called “part packages” to maximize the reuse of software assets. In addition to commercial middleware, eBinder also targets libraries created by users, device drivers, and other software assets. Using these mechanisms makes it possible to take advantage of existing software assets to achieve efficient development.
Learn moreeBinder system requirements
Windows
Learn moreBack to top